Report Designer Features
Report Designer includes the following features:
Count Objects
Based on the Report Type selection on the Report Editor, it displays the count (number) of Subject Areas, Entities/Tables, Attributes/Columns, Key groups/Indexes, and Relationsips that are present in the model. You can export this count to CSV format. On the Report Designer, click Export > Export Count to CSV.
Report Explorer Features
Move child nodes: To move the child nodes up or down within a parent node, right-click the node and click Move Up or Move Down. This option is to move child nodes within a parent node and not to move parent nodes in a report.
Result Grid Features
- Drag-and-drop: To change the order of columns, drag-and-drop the report node to the desired position in the Report Explorer pane. Select the report template and click Run current report on the toolbar.
- Sort: To sort the report results on a specific column, click the column header. The default sort order is the order in which you have created the objects in the model.
- Hide a column: To hide a column, click the column header and drag it away from the report until you see the cross mark. To display a hidden column, right-click a column header, click Columns, and then select the column that you want to display.
Note: Hidden columns are included when you export a report to CSV or HTML.
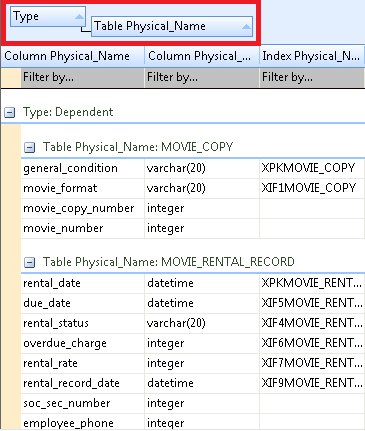
- Group the report result by a column: To group the report result by a column, click the column header and drag it to the Drag a column header here to group by that column section. The following illustration shows a report that is grouped by two columns:
- Rename a column: To rename a column, right-click the corresponding node in the Report Explorer and click Properties. Enter a new name in the Node Name field and click OK. Select the report template and click Run current report on the toolbar.
- Configure the look and feel of each column: To configure the look and feel of each column, right-click the corresponding node in the Report Explorer and click Properties. Complete the fields in the Customize report style section. Be aware that the styles applied to a parent node are not applied to child nodes automatically.
- Clear grid: To clear the data displayed in the result grid, click View, Clear gird. Clearing the result grid is a best practice when exporting a large or a complex report to HTML.
- Export to HTML, TXT, and PDF: To export a report or a Report Solution, right-click it and click Export to HTML, Export to CSV, or Export to PDF. When you export a report to CSV, select the delimiter as Comma Delimited to view the report in CSV format.
Pinned Reports
You can open the built-in reports from the Open pinned reports from disk toolbar item. The pinned reports are available in the local computer of the user. The reports are segregated into categories and each category of reports is available in a separate folder. You can create a folder of your own add the reports of your choice to it.
Several sample (pinned) reports are included with the application and they are available in the following location:
%Installdir%\erwin\Data Modeler r9\BackupFiles\Report Solutions
Also at the following location:
- Windows 7
C:\Users\<user name>\AppData\Local\erwin\Data Modeler\9.8\Report Solutions
Note: The pinned reports are created using a Logical-Physical model. If you use the pinned reports with a Logical-only or a Physical-only model, it may result in inappropriate results.
Reports that are copied directly under this folder do not appear in the Pinned Reports dialog. The reports must be in a subfolder under this folder.
|
Copyright © 2019 erwin, Inc.
All rights reserved.
|
|